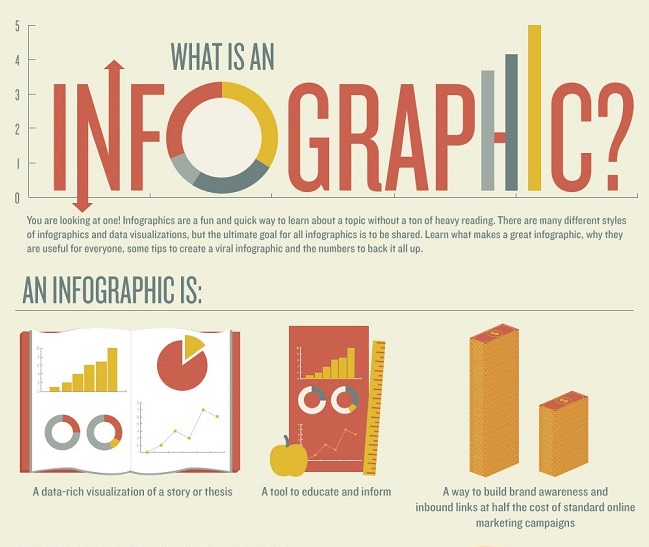
Now there are some discussions regarding how the infographics should be used. They also debate on the different formats used to make them. But everyone agrees they are a valuable tool regardless what style you use.
Just try to keep the images appropriate to the tone of the massage you’re wishing to get across. As an example, don’t use silly cartoons while trying express a serious topic. With that said, here are the more common infographics formats:
- Cause and Effect infographics demonstrate the relationships from on stage of the concept to the next. (Driving too fast may result in you getting a speeding ticket, which will affect your safety rating, which may cause you to lose customers).
- Chronological infographics share the stages of an event as it passes through time. (May third you got stopped for speeding, June 15thyou failed to show up at traffic court, July 21st customer XYZ went to the Federal Motor Carrier Safety Administration (FMCSA) and used their Safety and Fitness Electronic Records System (SAFER) checked out a company snapshot of your organization, noticed several unresolved traffic violations resulting in a negative rating. July 22nd XYZ cancelled their transporting contract with you.)
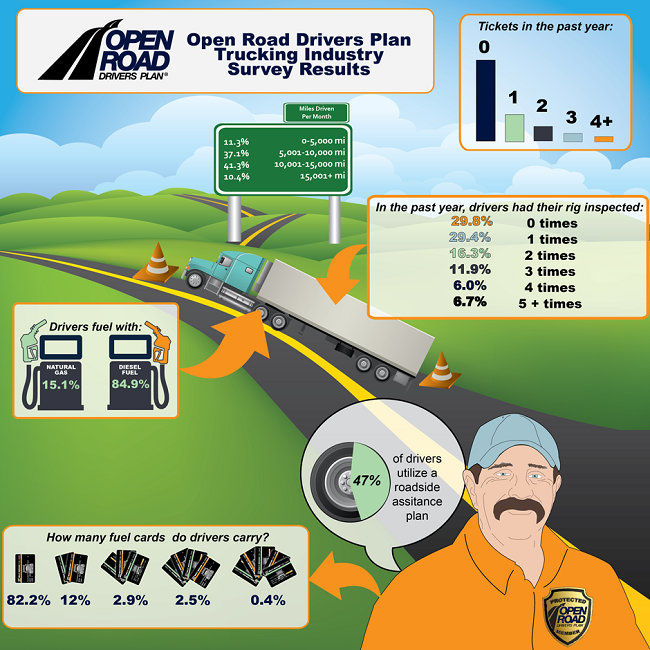
- Quantitative Infographics offer statistical data in an easy to read and understand format. These usually include charts and graphs, flow charts are very common. (Graph showing the number and type of traffic violations, per trucking company, over the course of a 12 month period, and detailing the types of violations (speeding, exceeding weight, lights not working, etc.).
- Directional Infographics are like road maps, they guide you from one point to the next. (Trucking industry infographics showing how strong well respected companies can slowly sink. This can happen by reduced safety standards, increased traffic related violations, the loss of clients, and either restructuring, selling, or closing.)
- Product Infographics are very common. They either are targeted to potential clients or staff. These are often like what you see with the nutritional pyramids in school, conveying an idea and why it is good. (Maintaining appropriate speeds equals safe driving and reduces tickets, accidents, and damages (and an increased safety rating), which results in gaining more clients who value a company’s efforts to observe proper safety).
Source: www.Trucks.com
